You may have heard that Twitter has been blocked in Brazil. It has been defying local authorities and justice blocked its access from Brazil.
Have that said, most Brazilians migrated to Bluesky, the social network created by Twitter's founder. I moved to there as well (feel free to follow me, be aware I post a lot in Portuguese) and I am amazed with two things:
* The REST API is well documented and easy to use;
* Bluesky supports The AT Protocol, which seems to be great alternative of how we consume content from the internet (which is currently dominated by suspicious algorithms).
In this post let's reach the API to query about Java and build a dashboard out of it.
The API Endpoint
We will be using the app.bsky.feed.searchPosts endpoint. It returns a JSON in the following format
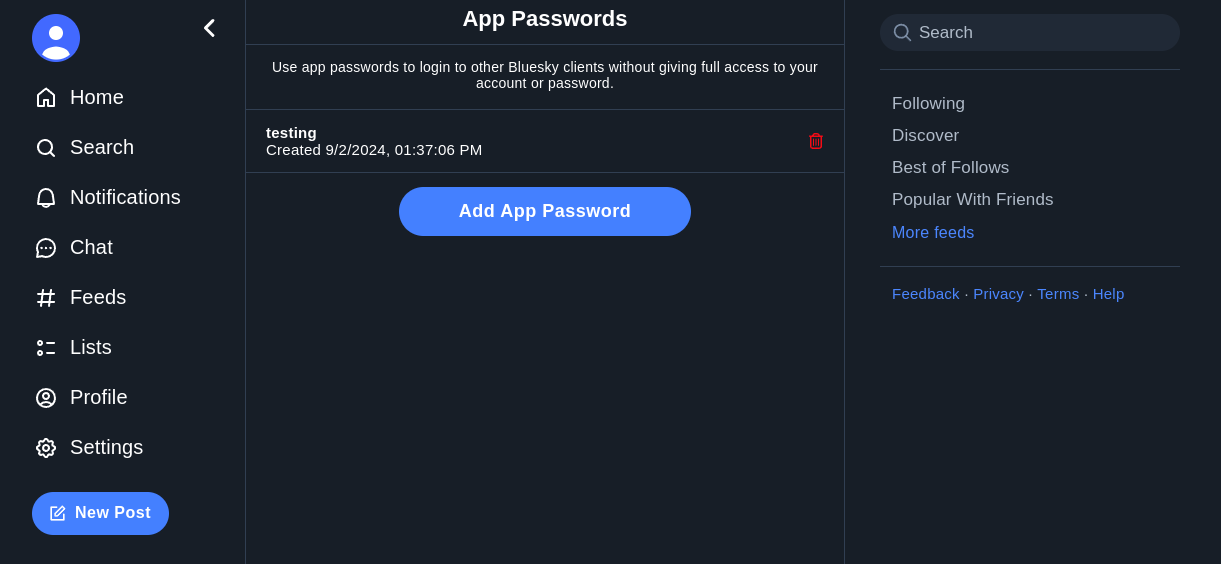
To query it we need an API Key, which can be acquired going to your Profile Settings -> App Passwords -> Create App Password
Our Application: A simple Dashboard
We used to use JavaFX or JavaFX Script on this blogs (e.g. Having fun creating a JavaFX App to Visualize Tweet Sentiments), but in this post we will be using a tool that I have been working until last year: Dashbuilder.
Dashbuilder allow us to write YAML that compiles to HTML pages and it is focused on Dashboard application, but is very flexible to render any external component, making it some sort of microfrontend tool.
Here are the steps we follow to create the dashboard:
* First we created the Dataset, which is basically the JSON above with a JSONAta expression to retrieve what we want. In our case we retrieved the author, author handle, text and the number of likes:
$.posts.[author.displayName, author.handle, record.text, likeCount]
* Then we extracted parameters from the dataset, such as the token, the search term and the API limit. This makes the YAML easily reusable;
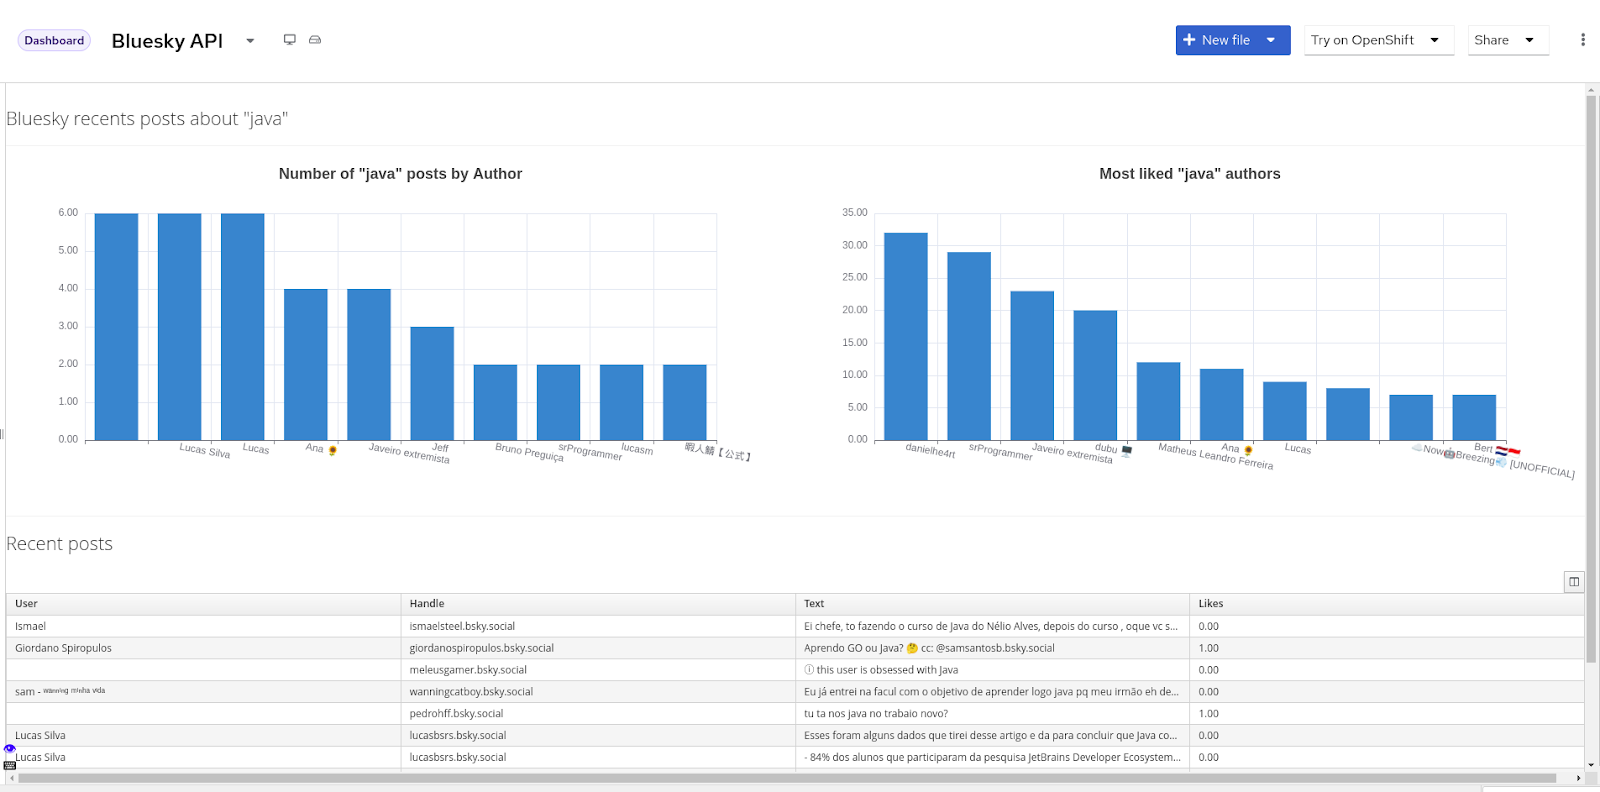
* Finally we created the actual visualization. In this part you are free to create what you want from the data, since I was just testing it I simply created two barcharts to show who is talking more about the term and the most liked user and a table with the requests. Here' s the result:

Thanks for reading!
Comentários
Postar um comentário